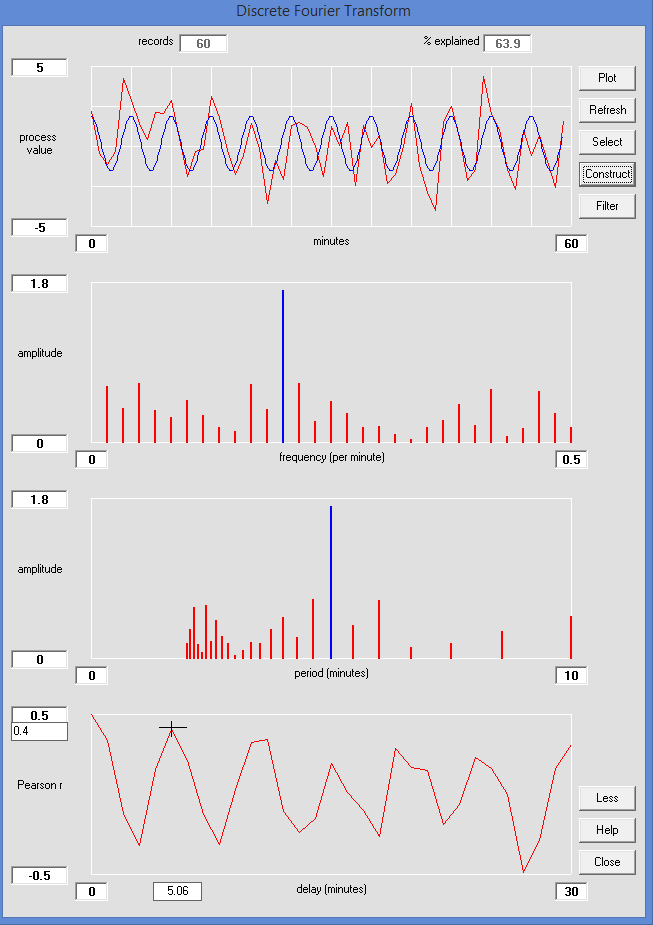
Fourier transformation will indentify the frequencies of any repeating pattern in the process data. The result is a spectrum showing the amplitude of each frequency. This might be used to help identify the source of an oscillation somewhere in the process. If this cannot be resolved, then the spectrum can also be used to design a filter. The user can select the dominant frequencies to plot a synthesised process trend. The software displays a '% explained' parameter indicating how much of the variation in the original signal has be modelled. The plot can be based on either discrete or continuous data.