The purpose of this module is to allow the process control engineer to properly determine the stastitics of process data. This might be to support the estimation of benefits prior to, or after, commissioning a control improvement. Or it might be to assess the performance of parts of the control scheme, such as the accuracy of inferential properties and dynamic models. The software addresses many of the issues arising from such application.
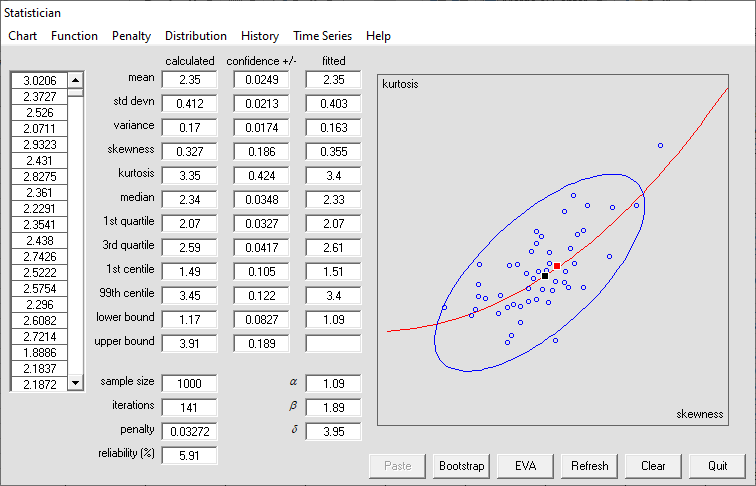
Conclusions can be based on far too small sets of data. This software determines the level of confidence that the user can have in the results, giving the opportunity to increase the size of the sample as necessary.
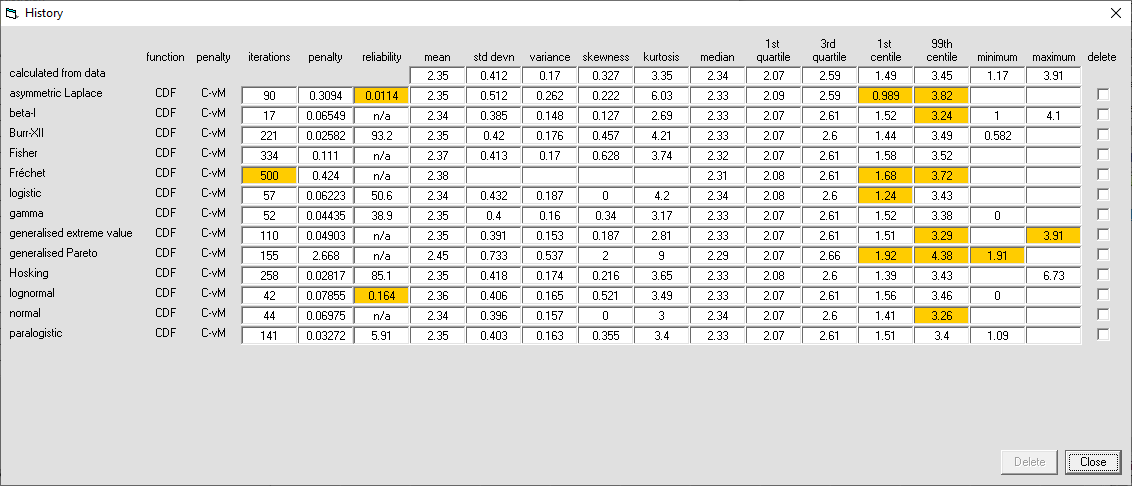
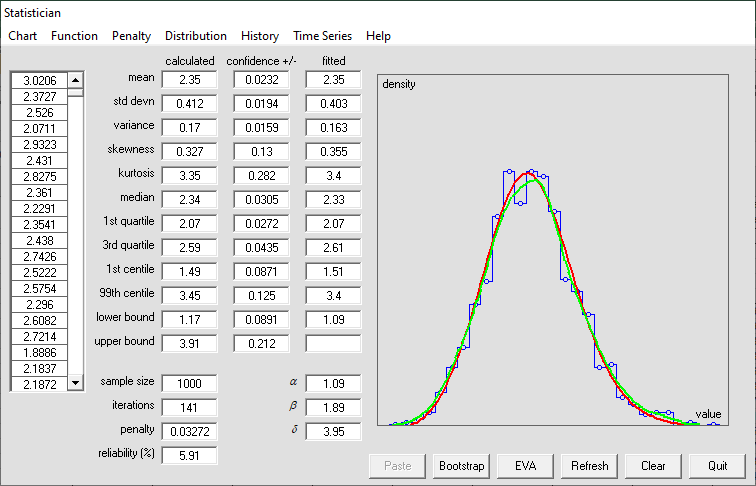
Parameters, such as mean and standard deviation, are usually determined by calculation directly from the data. This too can be misleading. The software determines these parameters by fitting the chosen distribution to the data. This gives a far more robust result and also largely removes the need to identify outliers.
Too often, analysis is performed assuming that the data are normally distributed. This assumption can result in drawing entirely the wrong conclusion about process behaviour.
Parameters such as skewsness and kurtosis are rarely considered. They do however offer a means of checking how well the chosen distribution fits the data.
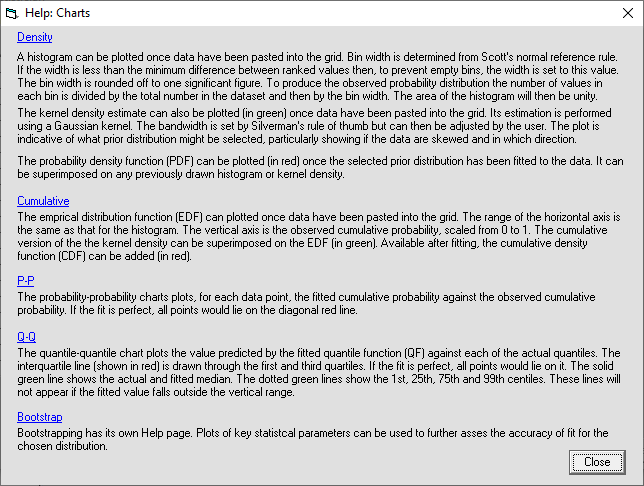
Statistical analysis is often performed to assess the probability of an extreme event. By their nature, few values will be collected under these conditions and so curve fitting will be unreliable at the tails of the distribution. The software helps detect this by comparing the actual and predicted centiles, and through the use of Q-Q plots. To resolve any problem it offers alternative methods of analysing such data.
The software is intended for use in conjunction with Myke King's book 'Statistics for Process Control Engineers: A Practical Approach'. The software includes some basic Help screens; full detail will be found in the book.
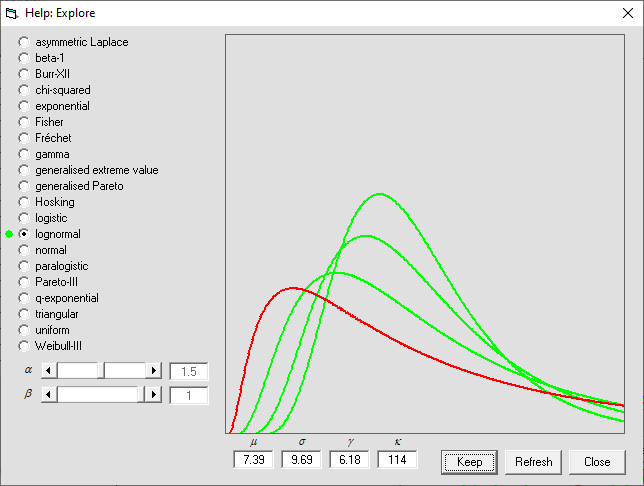
The distributions included represent only about 5% of those published. They have been selected because of their versatility and effectiveness. A full catalogue is included in the book with sufficient detail for the user to explore their application in, for example, a spreadsheet environment.